In the stock market, chart patterns are crucial in identifying the market direction. When we know the direction of the stock market, we can make a good amount of money. So, in today’s article, we will see the chart Patterns PDF and give you a free download link.
Today, we will learn about chart patterns. These are Double Top, Double Bottom, Triple Top, Triple Bottom, Head and Shoulders, Inverted Head and Shoulder, Falling Wedge, Rising Wedge, Symmetry Triangle, Ascending Triangle, Descending Triangle, Bullish Rectangle, Bearish Rectangle, Bullish Flag, Bearish Flag, Bullish Pennant, Bearish Pennant, Cup and Handle, Rising Bottom, etc.
All Chart Patterns PDF Free Download
| INFORMATION | DETAIL |
|---|---|
| Name | All Most Profitable Chart Patterns PDF Free Download |
| Category | Stock Market |
| Made by | pdfjunction.in |
| Size | 1.55 MB |
| No. of Pages | 6 |
| Link | DOWNLOAD |
Double Top
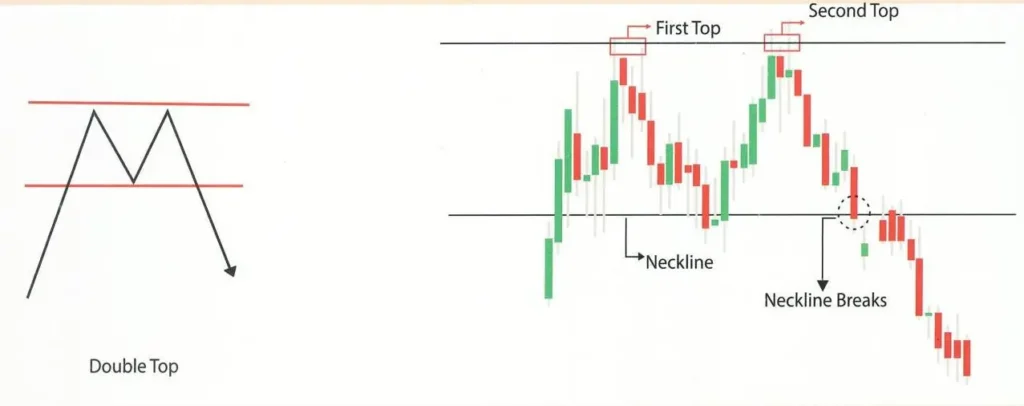
The double Top pattern is also known as the M top because its formation is the same as the letter M. Generally, the double top is formed when the trending market is about to end and a bullish market is about to start. That is why we also call it a bearish reversal chart pattern.
In this pattern, we can see there are two tops (both tops can be up or down by 3%), which is known as resistance. When the market falls from the first top, the percentage of falling market is about 10% to 20%. The volume at this moment is normal. When the market falls from the second top, the fall is very fast compared to the first top. And the volume at this moment increases gradually compared to the first top.
Double Bottom
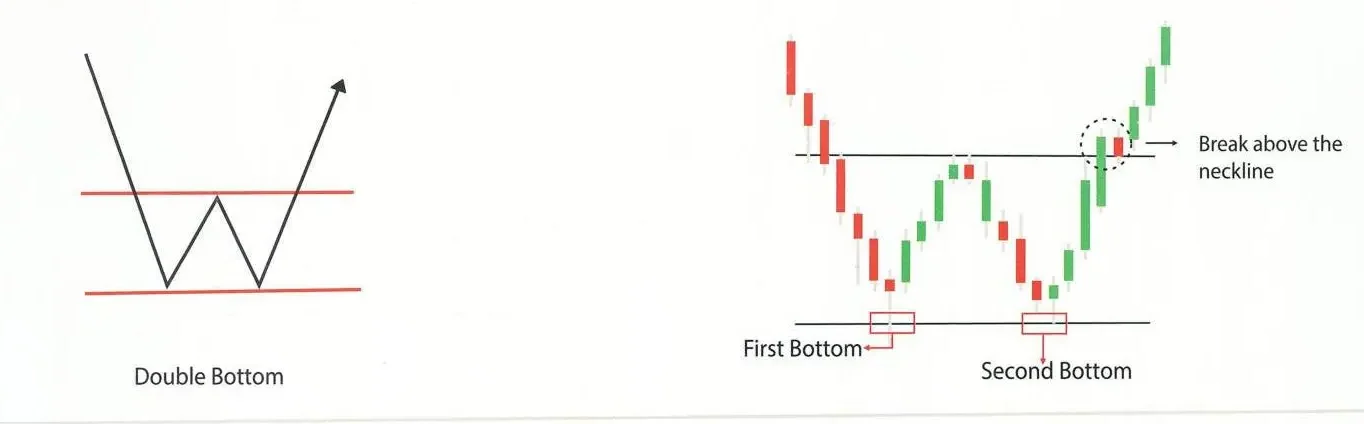
The Double Bottom pattern is the opposite of the Double top and is also known as the W bottom. It forms when a bullish market is about to end and a bullish market is about to start, which is why we also call it a bullish reversal chart pattern.
In this pattern, we can see there are two bottoms (both bottoms can be up or down by 3%), which is known as support when the market is up from the first bottom. Then, the percentage of the rising market is about 10% to 20%. When the market is up from the second bottom, then the rising market is very fast compared to the first bottom. And the volume at this moment increases gradually compared to the first top.
Triple Top
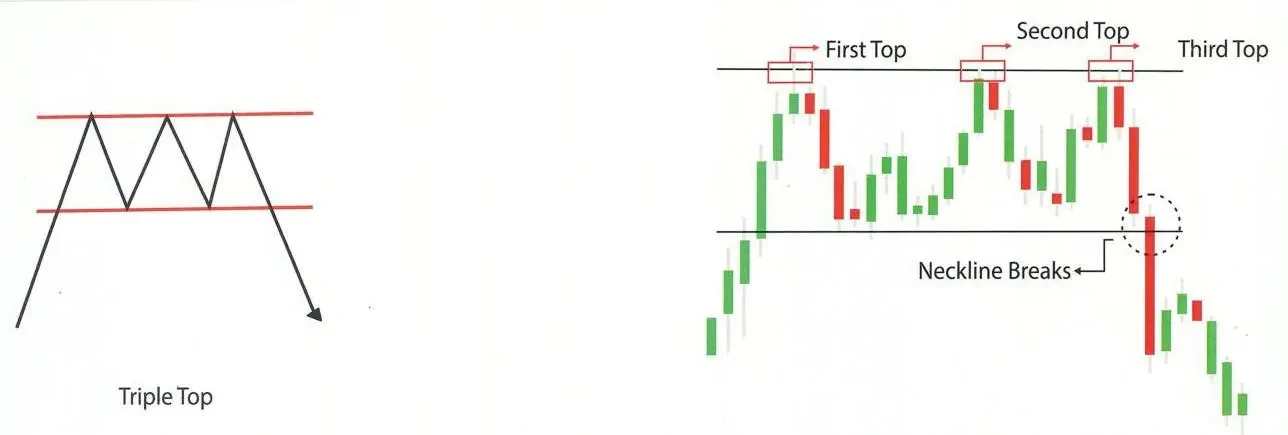
The Triple Top pattern is also known as the triple mountain because the figure of the triple top is very similar to the Mountains. The triple top is formed when the trending market is about to end and a bullish market is about to start. That is why we also call it a bearish reversal chart pattern.
In this pattern, we can see there are two supports and three resistances. When the first resistance is formed, it must be at the highest level of the previous trending market. At this moment, the market volume is higher than the second support and resistance. After creating the third resistance, the market fell very fast with big red candles, as you can see in the given image. At this moment, the volume is very high compared to the first resistance and support.
Triple Bottom
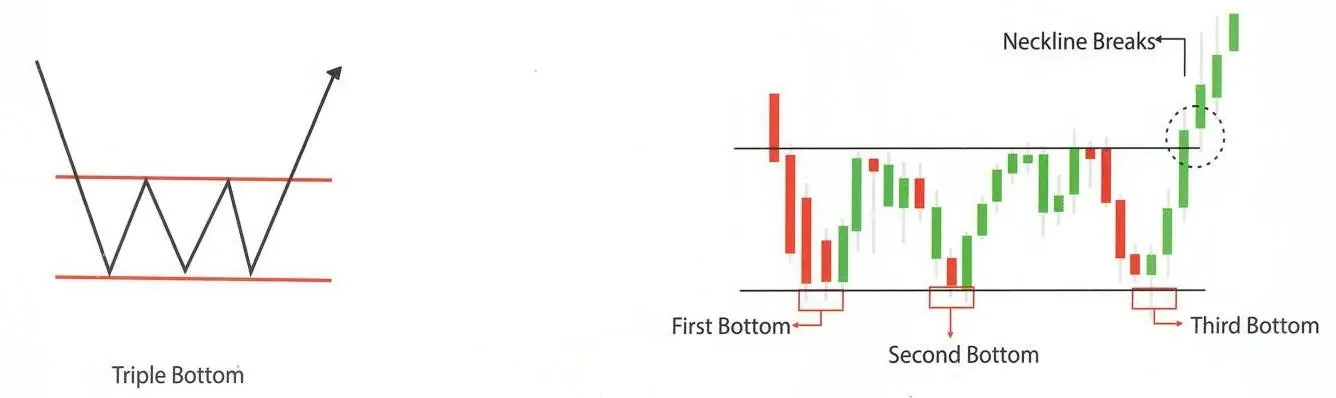
The triple bottom pattern is the opposite of the triple top. This pattern is also known as the three rivers because its figure resembles three rivers. The triple bottom is created when a bearish market is about to end and a trending market is about to start. That is why we also call it a bullish reversal chart pattern.
In this pattern, we can see there are three supports and two resistances. When the first support or bottom is formed, it must be at the lowest level of the previous bearish market. At this moment, the market volume is higher than the second resistance and support. After creating the third bottom, the market rises very fast. At this moment, the volume is very high compared to the first support and resistance.
Head and Shoulders
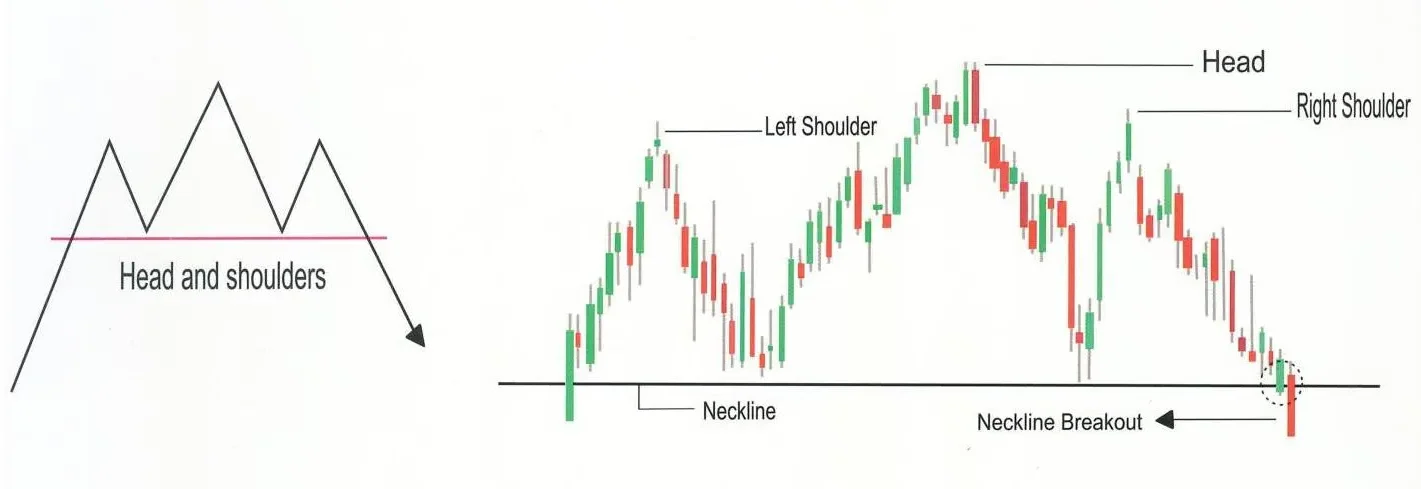
The head and shoulders are the same as a man’s shoulders and head. This pattern is also known as the three Buddhas. It is created when the trending market is about to end and a bullish market is about to start. That is why we also call it a bearish reversal chart pattern.
In this pattern, there are two supports and two resistances called shoulders. One more resistance is also formed above both shoulders, called the head. The volume is higher when the first shoulder is formed than the second. The position of both shoulders or resistance may be up and down. But in the case of the head, it’s always more extensive than both shoulders.
Inverted Head and Shoulder
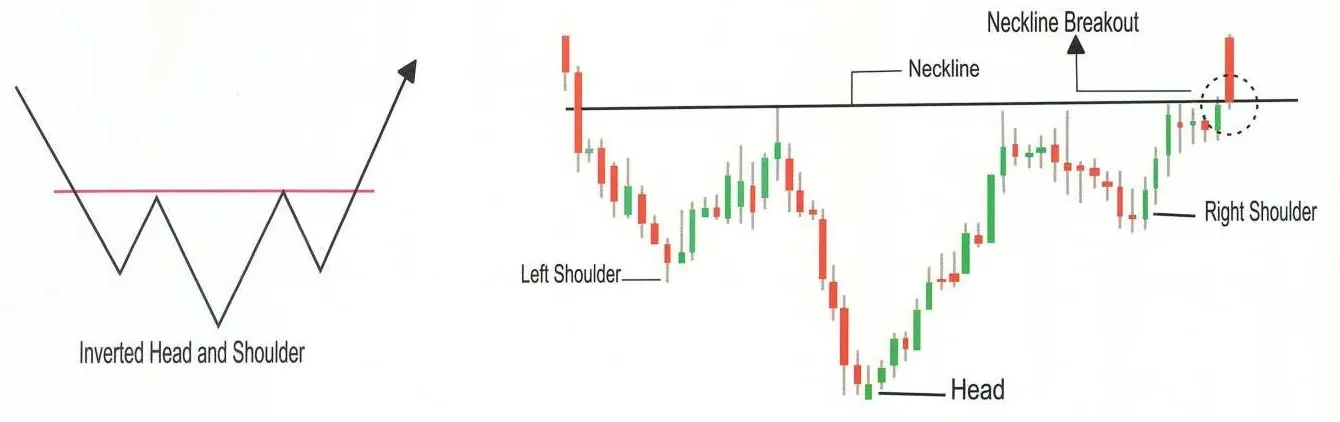
The inverted head and shoulders are the same as a man’s shoulders and head but in the opposite manner. This pattern is also known as the three Buddhas. It is created when the bearish market is about to end and a trending market is about to start. That is why we also call it a bullish reversal chart pattern.
In this pattern, there are two resistances and two supports called shoulders. One more support is also formed below both shoulders, called the head. The volume is higher when the first shoulder is formed than the second. The position of both shoulders or support may be up and down. But in the case of the head, it’s always more extensive than both shoulders.
Falling Wedge
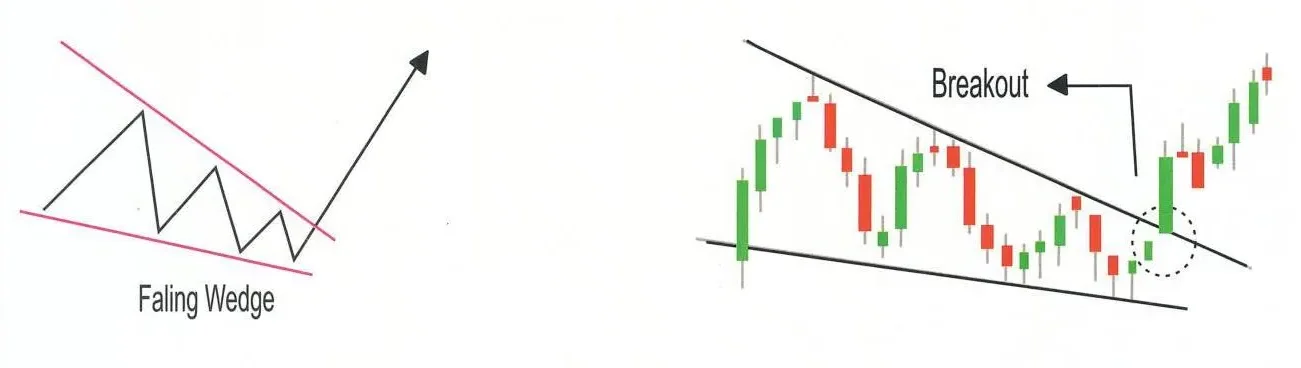
The falling wedge is also known as the Knife pattern because it is very similar to a knife. It is formed when the bearish market is about to end and a trending market is about to start. That is why we also call it a bullish reversal chart pattern.
This pattern should have at least two supports and two resistances. If there are more than two supports and two resistances, it is a perfect sign of a falling wedge chart pattern. Because it increases the accuracy of this pattern. After creating first support and resistance. When the second or more support and resistance are formed, the next support and resistance must be formed below the first support and resistance. After these things, you draw a trend line following the supports and resistance. Then, you can see a green candle break the resistance trend line, a falling wedge.
Rising Wedge
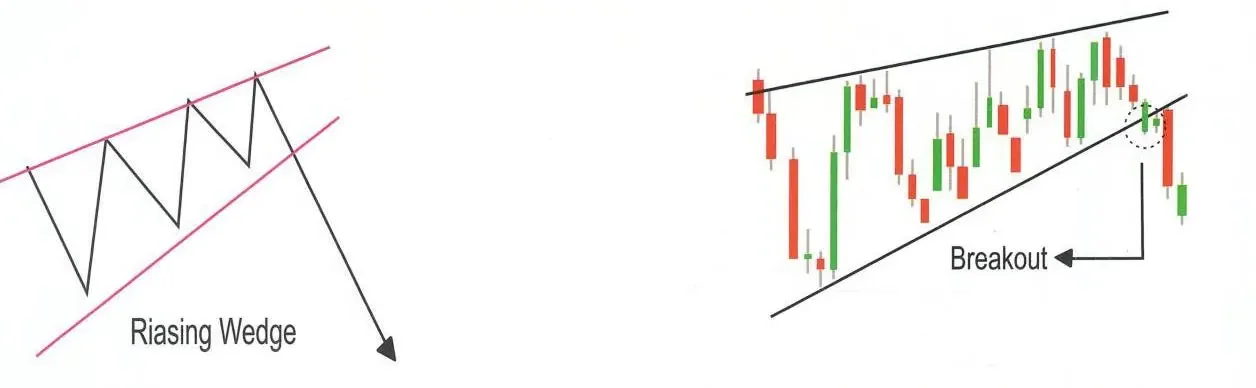
The rising wedge chart pattern is just opposite to the falling wedge. The only difference is that the falling wedge pattern is formed when the market is bearish, and the rising wedge pattern is created when the market is trending. That is why we also call it a bearish reversal chart pattern.
Symmetry Triangle
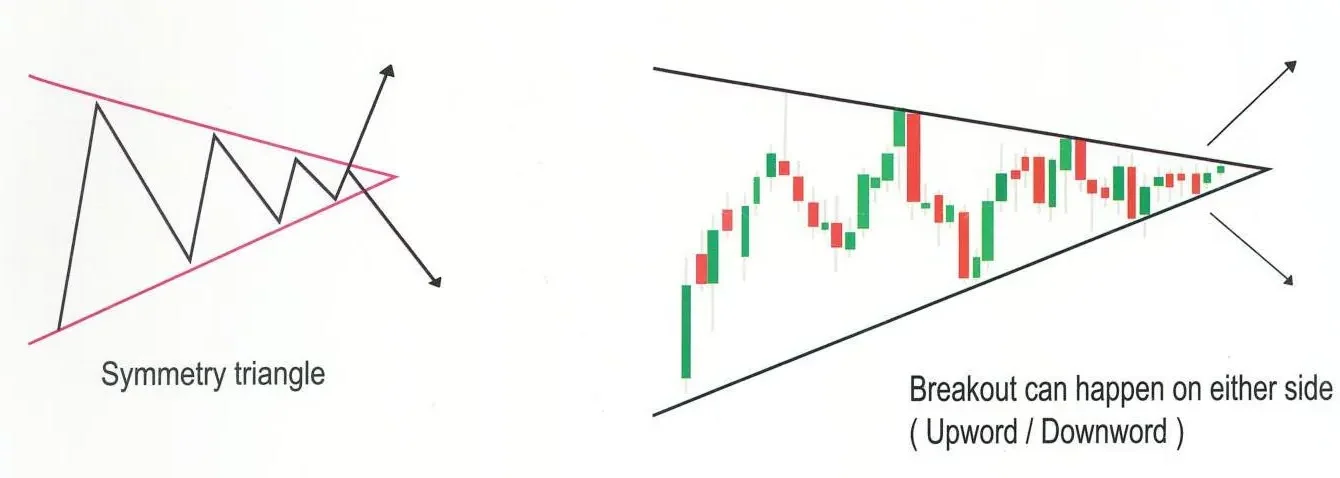
The symmetrical triangle chart pattern is formed by four or more triangles. This pattern can be of two types: bullish continuation symmetry triangles (which indicate that the market will remain trending) and bearish continuation symmetry triangles (which indicate that the market will remain bearish).
Bullish Continuation Symmetry Triangles
This pattern is created when the market is trending. After the first support and resistance, The second resistance is formed just below the first resistance. And the second support is formed just upside of the first support. Similarly, after creating three to four supports and resistances, when we draw a trend line to the support and resistance, we see that the trend line of the resistance is broken with a big green candle, called the bullish continuation symmetry triangle.
Bearish Continuation Symmetry Triangles
This pattern is the same as its bullish continuation symmetry triangle. The difference is that only this pattern is formed when the market is bearish.
Ascending Triangle
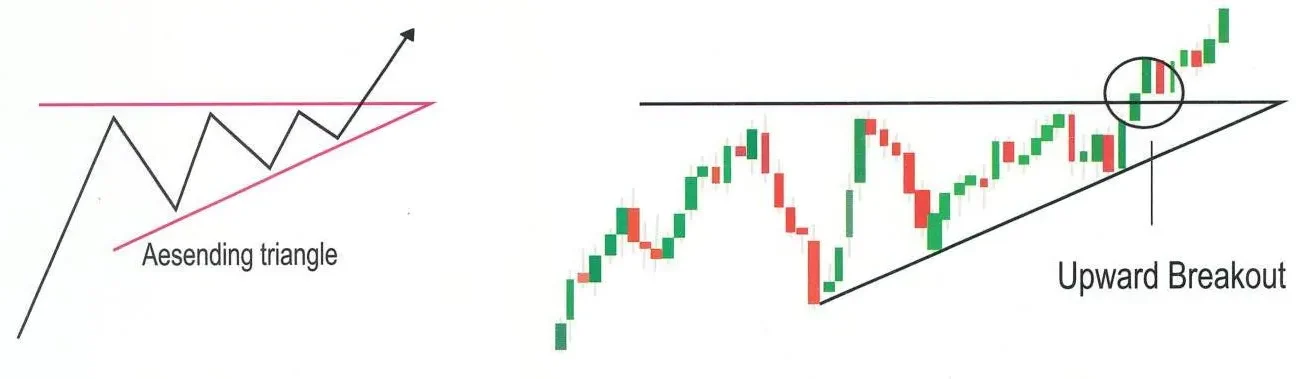
The Ascending Triangle is the same as the Bullish Continuation Symmetry Triangles.
Descending Triangle
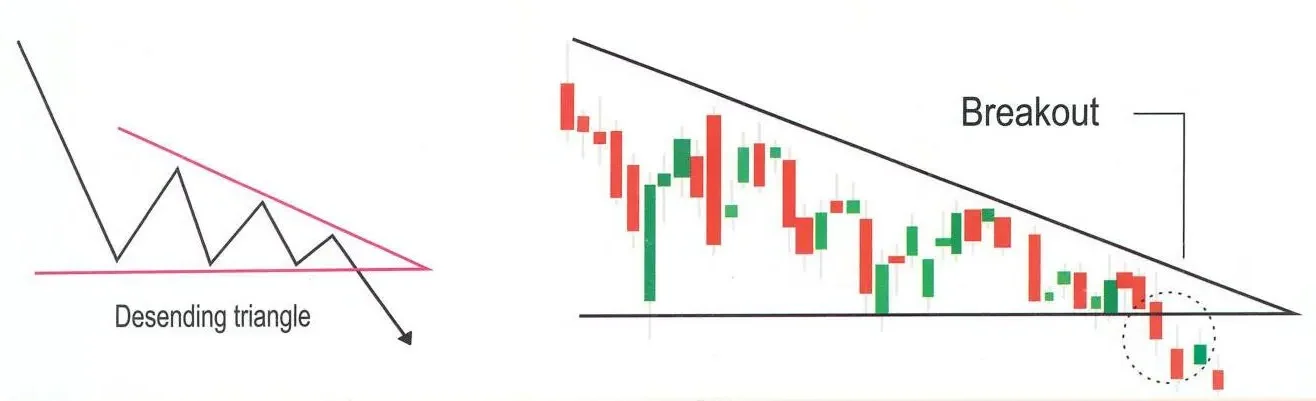
The Descending Triangle is the same as the Bearish Continuation Symmetry Triangles.
Bullish Rectangle
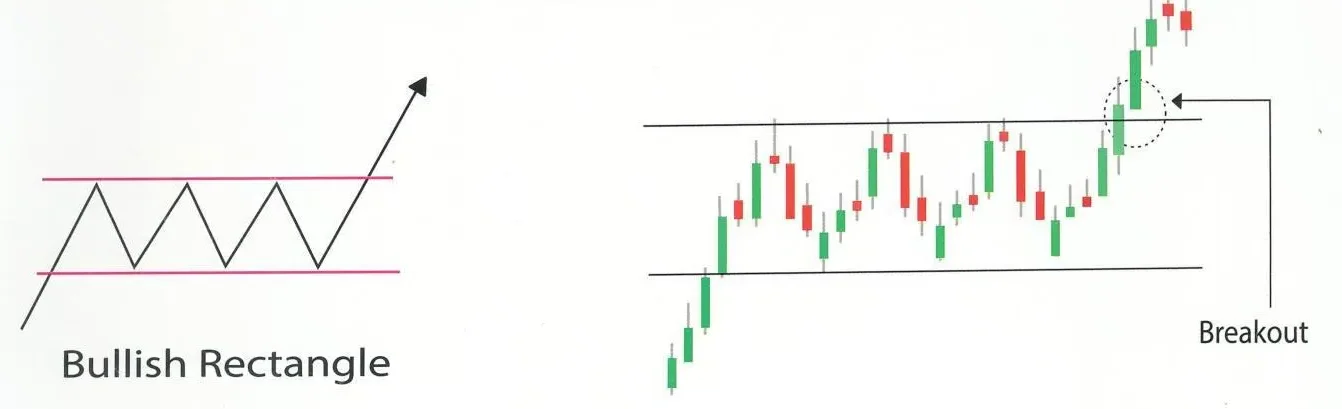
The bullish rectangle pattern is created when we draw two trend lines. The first is for resistance, and the second is for support. The bullish rectangle pattern has two types: bullish continuation rectangle and bearish continuation rectangle.
Bullish Continuation Rectangle
This pattern is created when the market is trending. After making the first resistance, the market comes down and makes another resistance, and then it goes up again, but this resistance level is the same as the previous one. These things happen two to four times. Then, we can see a breakout on the upside with a big green candle. The market’s volume at the start is average compared to the breakout moment. After a breakout, the volume gradually increases.
Bearish Continuation Rectangle
The Bearish Continuation Rectangle is the same as the Bullish Continuation Rectangle. However, the difference is that this pattern is created when the market is bearish (which indicates the market continues to the downside), and they give a breakout in the downside.
Bearish Rectangle Chat Pattern
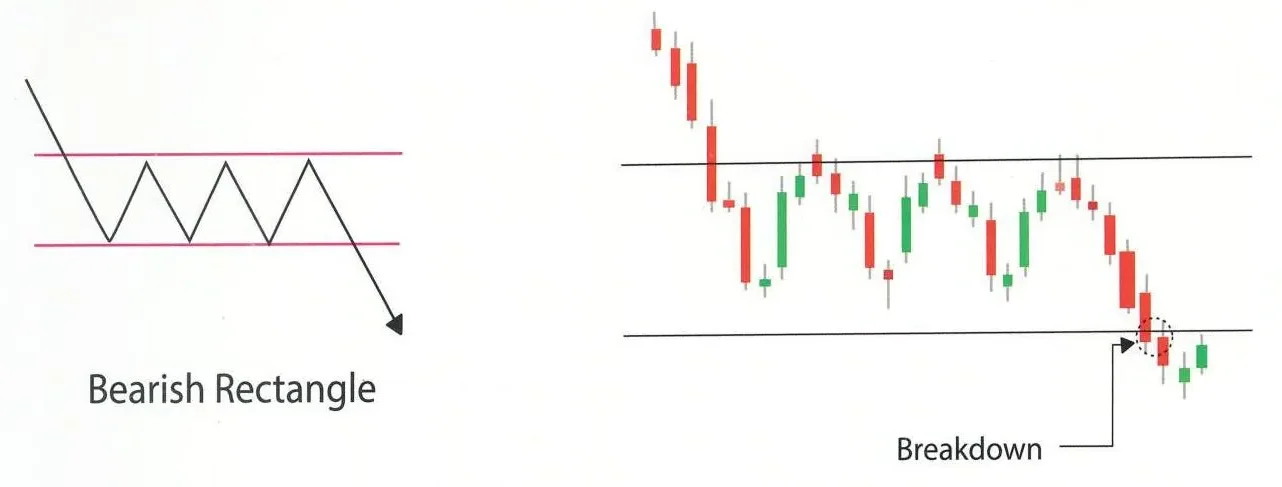
This pattern is the same as the Bullish Rectangle. The difference is that it is created only when the market is bearish. This pattern gives a breakout on the downside.
Bullish Flag
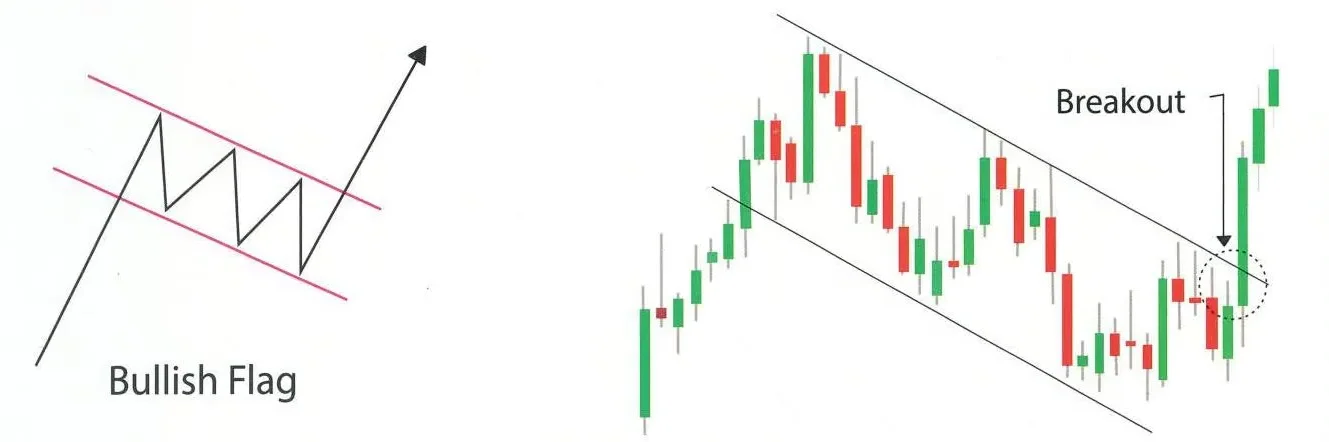
The bullish flag chart pattern is created when the market is very bullish. After trending, the market goes down with three to five resistance and support, as shown in the figure. Then, the market gives a breakout upside. During the formation of this pattern, volume is high, then goes low, and then is very high during breakout.
Bearish Flag
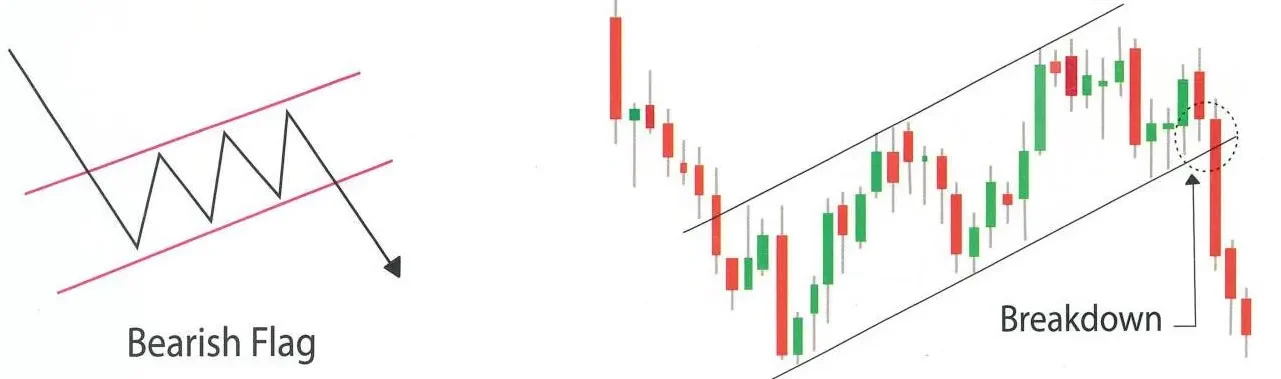
The bearish flag is the opposite of the Bullish Flag. The difference is that only this pattern is formed when the market is downtrend.
Bullish Pennant
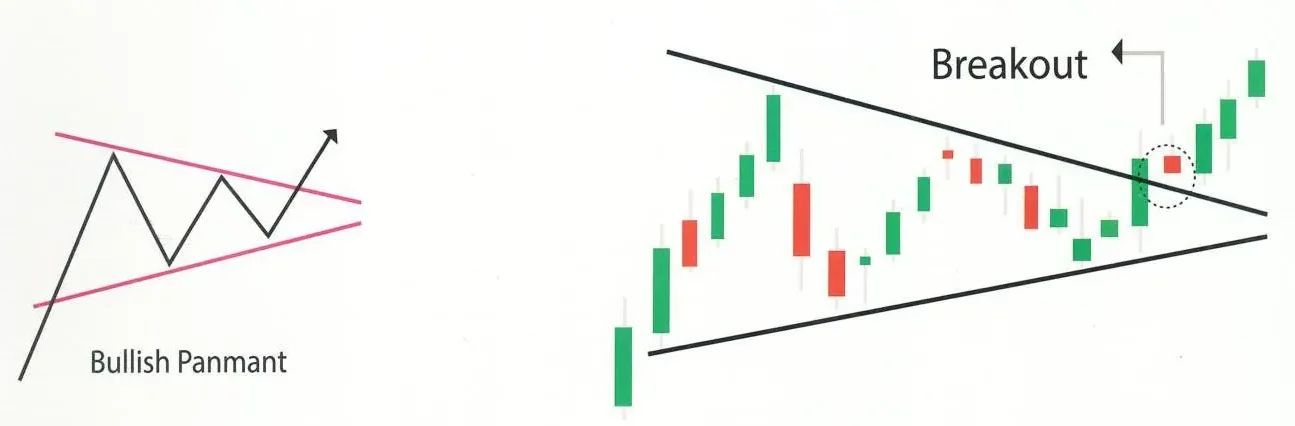
The bullish pennant pattern is created when the market is bullish. This pattern is also known as a bullish continuation flag. When resistance and support are made in this pattern and when we draw trend lines to the support and resistance, we can see the trend lines are not parallel, but they meet each other where the breakout has happened. In this pattern, there should be two minimum support and resistance created. Then, the volume increases gradually when the break-out happens.
Bearish Pennant
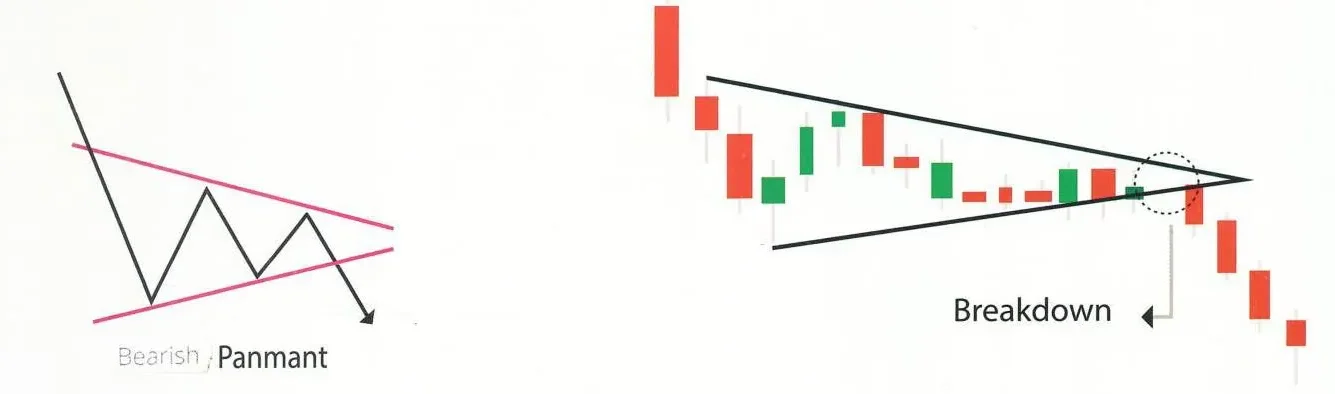
The Bearish Pennant Chart Pattern is opposite to the Bullish Pennant.
Cup and Handle
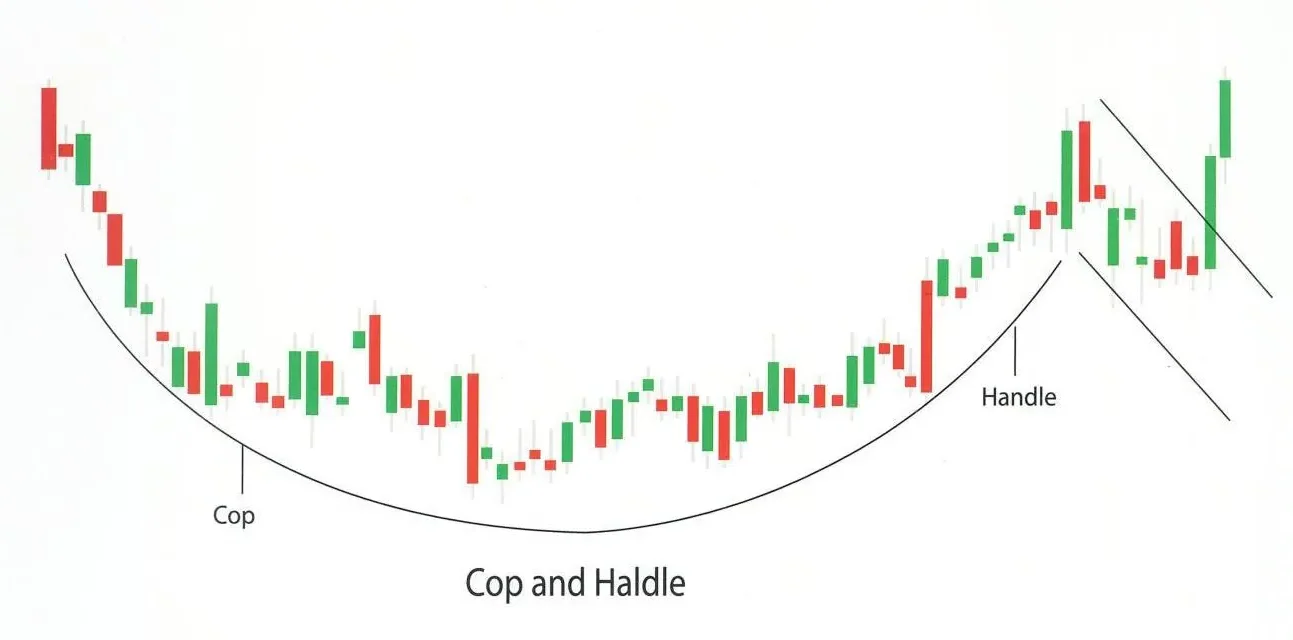
The Cup and Handle chart pattern is also known as the bullish continuation cup and handle formation. This pattern is formed when the market shows an uptrend. First, the market goes up for a bit and then forms a structure like a cup. Then, it goes a little bit down and forms a structure like the handle of a cup. This pattern is known as Cup and Handle.
Rounding Bottom
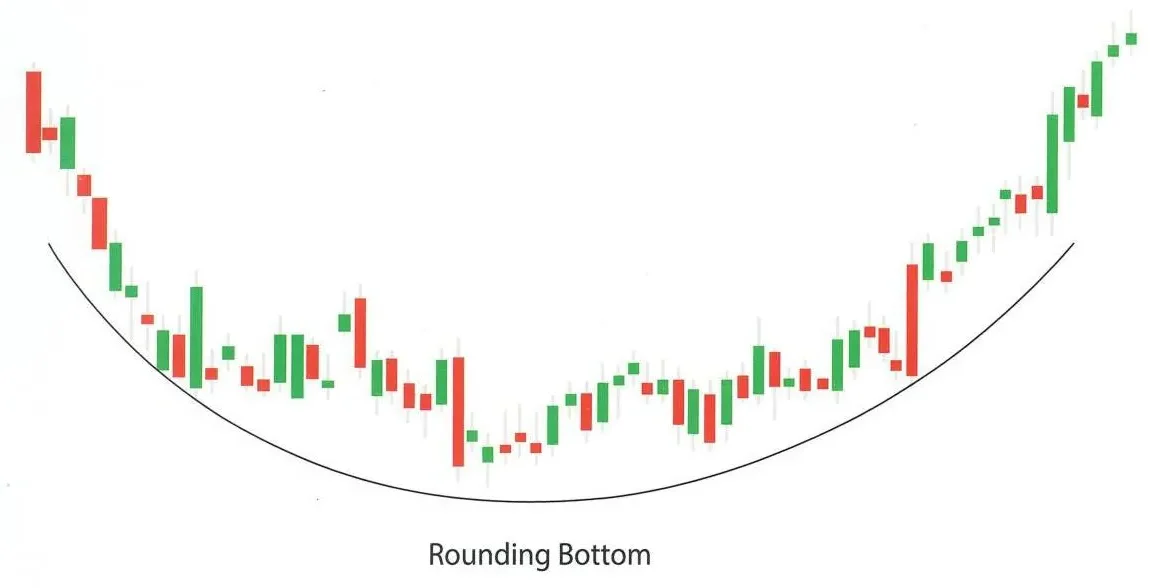
The rounding bottom, also known as the saucer bottom, is the same shape as the U letter and is known for the bullish reversal chart pattern. The Rounding bottom is not for short-term and intraday investing. It works only in long-term investing (around 10 to 20 years).
In this Rounding Bottom pattern, we can see all three trends: Uptrend, Downtrend, and Sideways. First, this trend shows a very slow downtrend, and then we can see sideways. After this, the market shows an uptrend, which is very fast compared to a downtrend and sideways.
3 thoughts on “All Chart Patterns PDF Free Download”