The trading candlestick patterns PDF is essential. By knowing all candlestick patterns in PDF, we can do better trading, make lots of money with correct entries and targets, and stop loss. We all know how the price action candlestick patterns PDF plays a significant role in our trading journey. So, in today’s article, I will provide you with PDF links to all the candlestick patterns, which you can download as free PDFs.
The Bullish and bearish candlestick patterns in PDF are very significant, the same as all chart patterns in PDF. Because with candlestick patterns PDF, you can understand the chart patterns. You need to know these things to be a profitable trader.
35 Powerful All Candlestick Patterns PDF Download
| INFORMATION | DETAILS |
|---|---|
| Name | All Candlestick Patterns Book PDF Download |
| Made by | PDF JUNCTION |
| Category | Stock Market |
| Size | 1.5 MB |
| No. of Pages | 60 |
| Link | DOWNLOAD |
Bullish Vs. Bearish
Hammer and Hanging Man
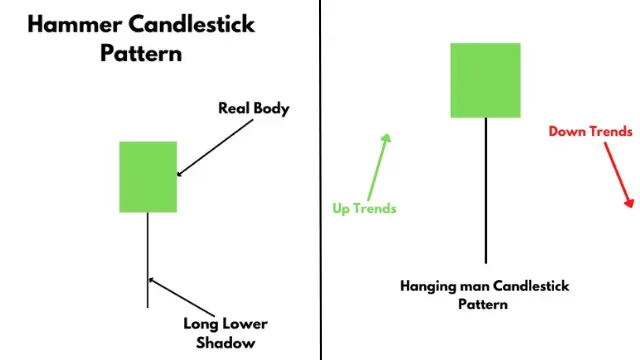
The Hammer and Hanging Man patterns look very similar. Both the candles look the same, but there is a difference in their colour. If this candle is red instead of green, it will also be a hammer candle. If this candle is green instead of red, it will also be a Hanging Man candle because the trend is essential here.
The Hammer candle is made in a downtrend. After this pattern, there is a chance of price increases. That’s why it is a bullish candle. At the same time, the Hanging Man candle is made in an uptrend. After this candle, there is a chance of the price falling. That’s why it is a bearish candle.
Inverted Hammer and Shooting Star
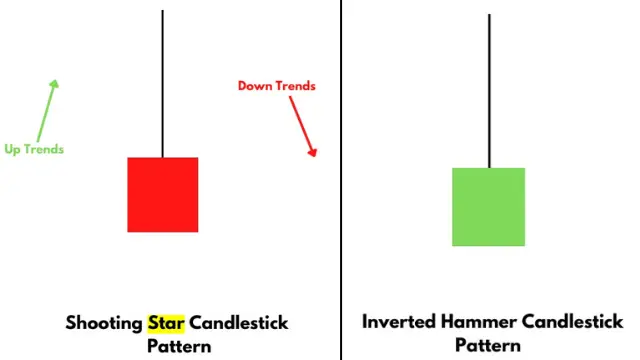
Inverted Hammer and Shooting Star, Both patterns look similar. You can see that this pattern looks something like this in the image. The difference is that the inverted hammer is green, and the shooting star is red. But if this is red instead of green, it will also be an Inverted Hammer pattern. If this is green instead of red, it will also be a Shooting Star pattern because the main significant difference here is the trend.
It is called an Inverted Hammer because it looks like a hammer is kept upside down. So, this pattern is made in a downtrend. That means if this pattern is made in a downtrend, it will be a bullion. After making this pattern, there is a chance of prices falling. And if this pattern is made in an uptrend, whether red or green, it will be a Shooting Star pattern.
After making this pattern, there is a chance of prices falling. And you can’t see any wick in this pattern below. However, if there is a small wick at this place, it is also considered a hammer pattern. And here, if there is a small wick at this place, it is regarded as a Shooting Star pattern.
Bullish Spinning Top and Bearish Spinning Top
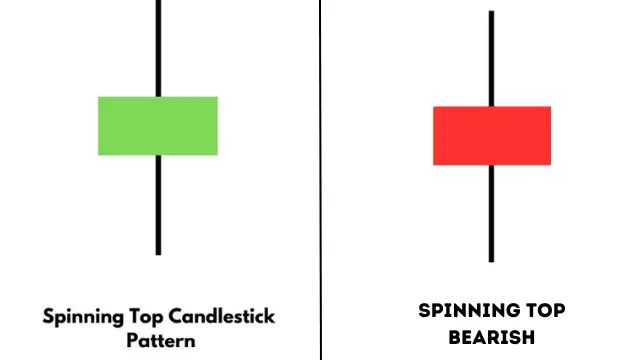
In the Bullish Spinning Top, the market is in a downtrend first. After that, a single candle is made with a tiny body. And whose upper and lower wick is almost two times of its body. Here, the upper and lower wick can be very small or big.
But they are almost equal. And this pattern looks like a Lattu. That’s why it is called a Spinning Top pattern. In the given image, I show you a green candle. If it is red, it will also be a Bullish Spinning Top. Because here, the trend is essential. After making this candle stick pattern, you have to mark it high. And after that, the next candle is made. If it gives a closing above its high, then there is a chance of the market increasing. But in this candlestick pattern, you should use volume for confirmation.
Their opposite candlestick pattern is a Bearish Spinning Top. The market is in an uptrend first. After that, a Spinning Top pattern is made. As it was made there. It is the same. In the given image, I show you a red candle. But in its place, if green, the colour can also be a Bearish Spinning Top pattern because it is made in an uptrend. After making this pattern, we have to mark it low. After marking it, the next candle is made of red. And it gives a closing below the low. So, there is a chance that the market will fall from here. But in this place, you should also use volume for confirmation.
Bullish Engulfing and Bearish Engulfing
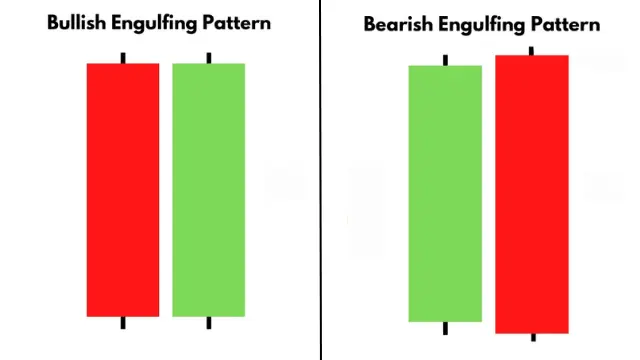
Bullish Engulfing and Bearish Engulfing are two candlestick patterns that look the same. These patterns are formed by combining two candles. The difference is that the first pattern, Bullish Engulfing, is made in a downtrend. And the first candle is made of red. After that, the next candle is made of green. Which opens below the red candle. And closes above the first red candle. Because of that, the green candle engulfs the red colour candle. And this is called Bullish Engulfing. After making this candle, it is assumed that the market will rise from here if a green candle is made.
Now, a similar pattern is Bearish Engulfing. In this, the market should be in an uptrend first. The first candle is made of a green candle. And after making the first candle. The market opens above and closes below the first green candle. Because of this, we see a big red colour candle. And this red candle engulfs the green candle. That’s why it is called Bearish Engulfing. After making this candle, if the next candle is made of red, it is assumed that the trend has reversed from here. And there are chances of the market falling.
Bullish Harami and Bearish Harami
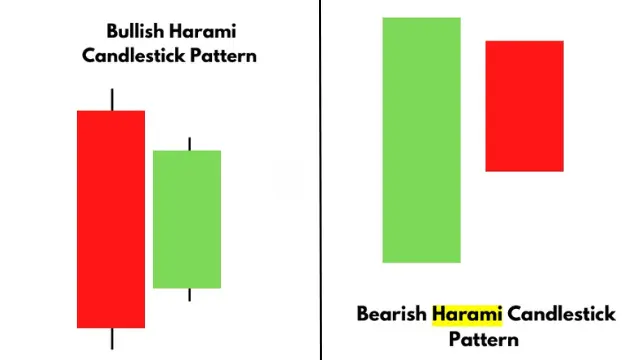
Harami means pregnant women. The market is in a downtrend first. After that, a big red candle is made. Now, after making a red candle, the opening of our next candle is above the red candle. And its closing is below the red candle. Because of this, our second green candle engulfs the entire body of the red candle. And it is assumed that this red candle is a woman. And this is her baby. After making this pattern, if the next candle is green, it gives a closing above this red candle. Then you can assume that a Bullish Harami pattern has formed. After making this pattern, there is a chance of the share price increasing.
Its opposite is the Bearish Harami pattern. Here, the market is in an uptrend first. After that, a big green candle is made. After making this green colour candle, the next candle’s opening is below the green colour candle. Its closing is above the green candle. Because of this, this green candle engulfs the entire body of the red candle. Like a pregnant woman has engulfed her baby. After making this candlestick pattern, if the next candle is red and gives a closing below this green candle, you can assume there is a chance of the market falling. And this is a Bearish Harami pattern.
Tweezer Bottom and Tweezer Top
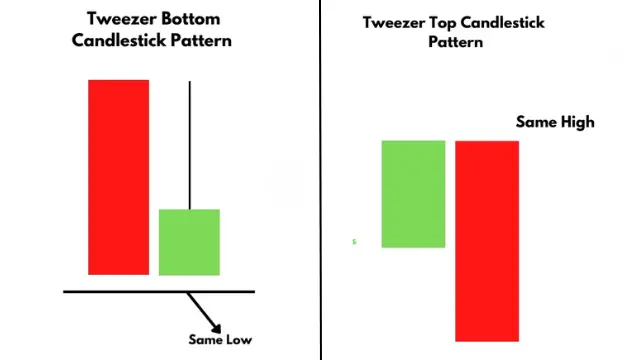
Tweezer’s bottom is a bullish candlestick pattern formed during a downtrend. That is, the market is falling before this. After that, a red candle is made. And after making this red candle, a green candle is made. Whose close and open price is equal. So, this area works as a support for you. After making this candle, the next candle gives a closing above this candle. So, there is a chance of the market increasing from here.
It’s opposite candlestick pattern is the Tweezer top, formed during an uptrend. The first candle is green. And after making that green candle, a red candle is made. Which is open from where the green candle is closed. And where the green candle was open, it is closed there. Because of this, these two candles look almost equal to you. So, if we look carefully, we will see resistance here. After making the red candle, the next candle is also red. Which gives a closing below this red candle. So, there is a chance that the market will fall from here.
Three White Soldiers and Three Black Crows
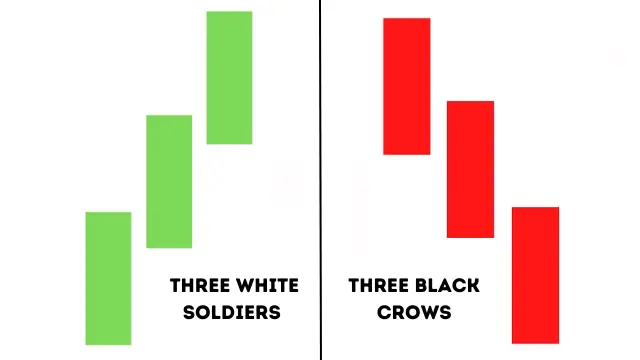
Three white soldiers are in a bullish candlestick pattern, with three big green-coloured candles. These candles have a tiny or no wick, as shown in the image. After making this pattern, there is a chance of a rise in the market.
The opposite is three black crows, of which three big red candles. And it either has a small wick, or it doesn’t have any wick in its body. After making this pattern, there is a chance of a fall in the market. That means the sellers are bullish, and the price will likely fall.

Your work has captivated me just as much as it has you. The sketch you’ve created is tasteful, and the material you’ve written is impressive. However, you seem anxious about the prospect of presenting something that could be considered questionable. I believe you’ll be able to rectify this situation in a timely manner.